
Are you eager to elevate your crypto trading game? Technical analysis is an essential skill that can help you make informed decisions in the dynamic world of cryptocurrency trading. Understanding key indicators will empower you to identify trends, predict price movements, and ultimately enhance your trading strategies. In this article, we’ll delve into the world of technical analysis and explore key indicators that can shape your success as a crypto trader.
- Moving Averages (MA):
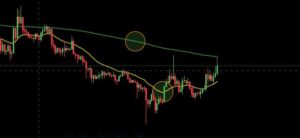
Moving Averages are fundamental tools used to smoothen price data over a specific period, enabling traders to identify trends more easily. The two primary types are Simple Moving Average (SMA) and Exponential Moving Average (EMA). By analyzing the intersections and relationships between different moving averages, traders can spot potential entry and exit points.
- Relative Strength Index (RSI):
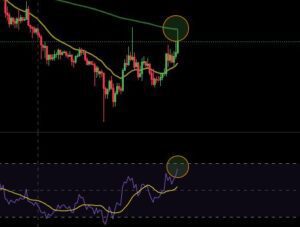
RSI is a momentum oscillator that measures the speed and change of price movements. It ranges from 0 to 100 and helps traders identify overbought or oversold conditions in the market. When the RSI value exceeds 70, it suggests overbought conditions, while a value below 30 indicates oversold conditions. These signals can assist in timing your trades effectively.
- Bollinger Bands:
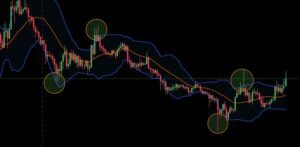
Bollinger Bands consist of three lines: the middle band (SMA), and two outer bands representing standard deviations from the SMA. The bands expand and contract with volatility. When the price approaches the upper band, it may indicate overbought conditions, while reaching the lower band suggests oversold conditions. Traders use Bollinger Bands to assess potential price reversals.
- Moving Average Convergence Divergence (MACD):
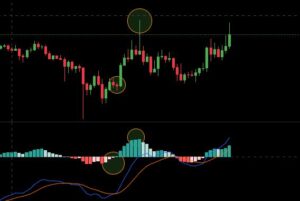
MACD is a versatile indicator that combines moving averages to detect changes in price momentum. It comprises two lines: the MACD line and the Signal line. When the MACD line crosses above the Signal line, it generates a bullish signal, and vice versa. Traders use MACD to identify trend changes and gauge market momentum.
- Fibonacci Retracement:
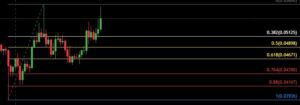
Fibonacci retracement levels are based on mathematical ratios and are commonly used to identify potential support and resistance levels. Traders use Fibonacci retracement to determine areas where the price may reverse its trend, making it a valuable tool for planning entry and exit points.
Conclusion:
Mastering technical analysis is a key aspect of successful crypto trading. By familiarizing yourself with essential indicators like Moving Averages, RSI, Bollinger Bands, MACD, and Fibonacci retracement, you can gain valuable insights into the market’s behavior.
Now that you have gained insights into mastering technical analysis and its significance in crypto trading, it’s time to take the next step towards your trading success. If you’re eager to explore the world of crypto trading with the support of a reputable funding program, look no further than Hyrotrader.
Hyrotrader offers a cutting-edge funding program for crypto traders on Binance and ByBit, providing access to crypto proprietary trading firms with funded accounts. By joining Hyrotrader, you’ll have the opportunity to leverage your trading skills and maximize your earning potential. Whether you’re an experienced trader or a beginner, our customer-centric approach, top-notch support, and extensive resources will help you excel in the dynamic crypto market.
Don’t miss the chance to be a part of a thriving community of traders and capitalize on our funding program. Visit our website now to learn more about Hyrotrader’s Funding Program for crypto traders on Binance and ByBit. Take the first step towards achieving your trading goals and unlock the potential to become a successful crypto trader with Hyrotrader’s funding support!